Tutorial: outage timeline — Belgian generation units
Outages 15.1.A/B publishes a notice for every generation-unit outage in a bidding zone. The wrapper unavailability_of_generation_units returns one row per event: window, resource, technology, rated MW. This page pulls a real BE month and turns it into a Gantt-style timeline coloured by rated capacity.
The HTTP body is application/zip (one XML doc per notice); the wrapper unzips it transparently and vcats the parsed parse_unavailability results.
Setup
using ENTSOE
using CairoMakie
using Dates

CairoMakie.activate!(type = "png")

include(joinpath(pkgdir(ENTSOE), "test", "_brokenrecord_helpers.jl"))
const BR = _load_brokenrecord()
# The outage cassette is BSON because the response is `application/zip` —
# YAML can't byte-stably round-trip binary bodies.
BR.configure!(; extension = "bson")
client = ENTSOEClient("PLAYBACK")
Fetch one month's planned outages
notices = BR.playback("tut_outages_BE_2024.bson") do
    unavailability_of_generation_units(
        client, EIC.BE,
        DateTime("2024-01-01T00:00"), DateTime("2024-02-01T00:00");
        business_type = BusinessType.PLANNED_OUTAGE,
    )
end
length(notices), propertynames(notices)
(26, (:start, :stop, :business_type, :resource_name, :resource_mrid, :psr_type, :nominal_mw))Sample row:
notices[1](start = Dates.DateTime("2023-10-11T15:37:00"), stop = Dates.DateTime("2024-03-05T08:00:00"), business_type = "A53", resource_name = "RODENHUIZE 4", resource_mrid = "22WRODENH000213L", psr_type = "B01", nominal_mw = 268.0)Gantt chart, coloured by rated MW
Each row is one outage event — horizontal bar spans start→stop, positioned by resource name on Y, coloured by rated MW on a viridis scale. We convert times to days since 1 Jan 2024 for the X axis (Makie's DateTime axis support is version-dependent — index-based plotting is robust).
ordered_resources = unique(notices.resource_name)
y_of = Dict(name => i for (i, name) in enumerate(ordered_resources))
ref = DateTime("2024-01-01T00:00")

# X-axis: days since the reference. Negative = outage started before
# the query window opens.
to_days(t) = (t - ref).value / 86_400_000   # ms → days

finite_mw = filter(!isnan, notices.nominal_mw)
mw_range = isempty(finite_mw) ? (0.0, 1.0) : (Float64(minimum(finite_mw)),
                                              Float64(maximum(finite_mw)))

fig = Figure(size = (1000, 120 + 26 * length(ordered_resources)))
ax = Axis(fig[1, 1];
    title  = "Planned generation outages — Belgium, Jan 2024",
    xlabel = "Days since 1 Jan 2024",
    yticks = (1:length(ordered_resources), ordered_resources),
    yticklabelsize = 9,
    yreversed = true,
)

cgrad_v = Makie.cgrad(:viridis)
for row in notices
    y = y_of[row.resource_name]
    span = mw_range[2] - mw_range[1]
    c = isnan(row.nominal_mw) ? RGBAf(0.55, 0.55, 0.55, 0.85) :
        cgrad_v[clamp((row.nominal_mw - mw_range[1]) / max(span, 1.0), 0, 1)]
    lines!(ax, [to_days(row.start), to_days(row.stop)], [y, y];
        color = c, linewidth = 8)
end

Colorbar(fig[1, 2], colormap = :viridis, limits = mw_range,
    label = "Rated MW", height = Relative(0.7))
fig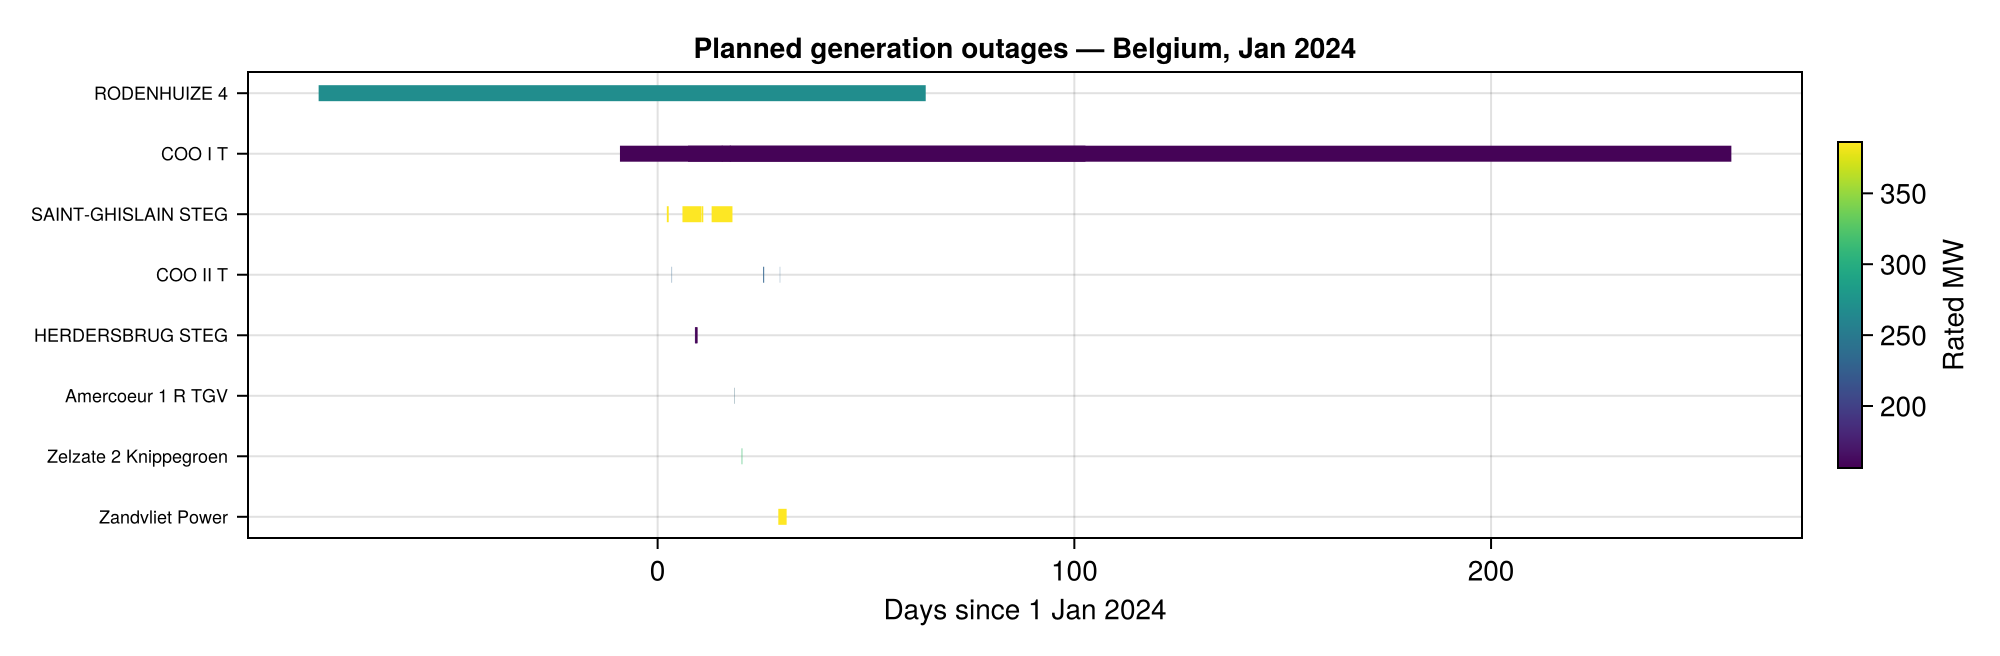
The plot reads directly:
Long horizontal bars are multi-month or multi-year outages spilling into the January window — typically refits or fuel-change campaigns. Several Belgian generation units sit in maintenance for months at a time.
The colour ramp shows which units carry the most rated capacity per outage event; the brightest bars are the largest plants offline.
Per-station summary
by_resource = Dict{String, NamedTuple{(:n, :total_outage_days, :rated_mw),
                                      Tuple{Int, Float64, Float64}}}()
for row in notices
    name = row.resource_name
    days = (row.stop - row.start).value / 86_400_000
    cur = get(by_resource, name,
        (n = 0, total_outage_days = 0.0,
         rated_mw = isnan(row.nominal_mw) ? 0.0 : row.nominal_mw))
    by_resource[name] = (
        n = cur.n + 1,
        total_outage_days = cur.total_outage_days + days,
        rated_mw = cur.rated_mw,
    )
end

sorted = sort(collect(by_resource); by = p -> -p.second.total_outage_days)
first(sorted, min(5, length(sorted)))
5-element Vector{Pair{String, @NamedTuple{n::Int64, total_outage_days::Float64, rated_mw::Float64}}}:
"COO I T" => (n = 5, total_outage_days = 362.6666666666667, rated_mw = 158.0)
"RODENHUIZE 4" => (n = 1, total_outage_days = 145.6826388888889, rated_mw = 268.0)
"SAINT-GHISLAIN STEG" => (n = 5, total_outage_days = 10.384722222222223, rated_mw = 386.0)
"Zandvliet Power" => (n = 1, total_outage_days = 1.9986111111111111, rated_mw = 386.2)
"HERDERSBRUG STEG" => (n = 7, total_outage_days = 1.2222222222222223, rated_mw = 157.0)Where to next
unavailability_of_production_units(Outages 15.1.C/D) for whole-station outages.unavailability_of_transmission_infrastructure(10.1.A/B) for cross-border interconnector outages.parse_unavailability_curvewalks each<Available_Period>to return the per-15-min curtailment trajectory — useful when the outage is partial (the unit ran at, say, 50% during the window).