Tutorial: Belgian gas fleet from master data
The Master Data endpoint returns the registered-resource registry: every production unit ENTSO-E knows about, with its constituent generating units, technology, rated MW, and location. The wrapper production_and_generation_units flattens this into one row per generating unit with the parent production unit carried as context, parsed by parse_master_data.
This page asks: what does Belgium's B04 — Fossil gas fleet look like?
Setup
using ENTSOE
using CairoMakie
using Dates
using Statistics: mean, median

CairoMakie.activate!(type = "png")

include(joinpath(pkgdir(ENTSOE), "test", "_brokenrecord_helpers.jl"))
const BR = _load_brokenrecord()
client = ENTSOEClient("PLAYBACK")
Pulling the registry
production_and_generation_units is the unusual wrapper that takes a single date rather than a period — the master-data document is a snapshot of the registry as of that day.
units = BR.playback("tut_master_data_BE.yml") do
    production_and_generation_units(
        client, EIC.BE;
        implementation_date = "2017-01-01",
        business_type = BusinessType.PRODUCTION_UNIT,
        psr_type = PsrType.FOSSIL_GAS,
    )
end
length(units), propertynames(units)
(40, (:production_unit_mrid, :production_unit_name, :generating_unit_mrid, :generating_unit_name, :psr_type, :nominal_mw, :location, :bidding_zone, :implementation_date))Sample row — note how the production-unit context is carried beside each generating-unit detail:
units[1](production_unit_mrid = "22W20181005PU--J", production_unit_name = "VILVOORDE TGV", generating_unit_mrid = "22W20181005GU--R", generating_unit_name = "VILVOORDE GT", psr_type = "B04", nominal_mw = 264.0, location = "Belgium", bidding_zone = "10YBE----------2", implementation_date = "2021-05-19")Per-station breakdown
Production units in Belgium are sites containing one or more generating units (a CCGT block might be one steam + one gas turbine). Group by production_unit_name to see the station-level decomposition.
stations = unique(units.production_unit_name)
station_totals = [
    (
        name = name,
        n_units = count(==(name), units.production_unit_name),
        total_mw = round(Int, sum(units.nominal_mw[units.production_unit_name .== name])),
    )
    for name in stations
]
sort!(station_totals; by = s -> -s.total_mw)
station_totals
16-element Vector{@NamedTuple{name::String, n_units::Int64, total_mw::Int64}}:
(name = "HERDERSBRUG STEG", n_units = 6, total_mw = 947)
(name = "Flémalle CCGT", n_units = 1, total_mw = 890)
(name = "Luminus Seraing 2.0 CCGT", n_units = 2, total_mw = 875)
(name = "T-power Beringen", n_units = 2, total_mw = 842)
(name = "DROGENBOS TGV", n_units = 6, total_mw = 825)
(name = "Marcinelle Energie (Carsid)", n_units = 2, total_mw = 818)
(name = "Zandvliet Power", n_units = 2, total_mw = 804)
(name = "RINGVAART STEG", n_units = 2, total_mw = 750)
(name = "SAINT-GHISLAIN STEG", n_units = 2, total_mw = 736)
(name = "EDF Luminus Seraing TGV", n_units = 3, total_mw = 470)
(name = "Amercoeur 1 R TGV", n_units = 2, total_mw = 451)
(name = "INESCO WKK", n_units = 5, total_mw = 409)
(name = "VILVOORDE TGV", n_units = 2, total_mw = 385)
(name = "Zelzate 2 Knippegroen", n_units = 1, total_mw = 315)
(name = "VILVOORDE GT", n_units = 1, total_mw = 255)
(name = "Scheldelaan Exxonmobil", n_units = 1, total_mw = 140)Horizontal bar chart, stacked by generating unit
Each station gets a horizontal stack — segments are the generating units that compose it. Reading the chart you can immediately spot which sites are single-unit and which are multi-unit CCGTs.
n_stations = length(station_totals)
fig = Figure(size = (920, 90 + 32 * n_stations))
ax = Axis(fig[1, 1];
    title  = "Belgian fossil-gas fleet (B04) — production-unit decomposition",
    xlabel = "Rated MW",
    yticks = (1:n_stations, [s.name for s in station_totals]),
    yreversed = true,
)

palette = Makie.wong_colors()
for (i, station) in enumerate(station_totals)
    mask = units.production_unit_name .== station.name
    gens = units[mask]
    cum = 0.0
    for (j, g) in enumerate(gens)
        isnan(g.nominal_mw) && continue
        color = palette[mod1(j, length(palette))]
        barplot!(ax, [i], [g.nominal_mw];
            direction = :x, offset = cum,
            color = color, gap = 0.2, dodge_gap = 0.0,
            strokewidth = 0.5, strokecolor = :white)
        cum += g.nominal_mw
    end
end
fig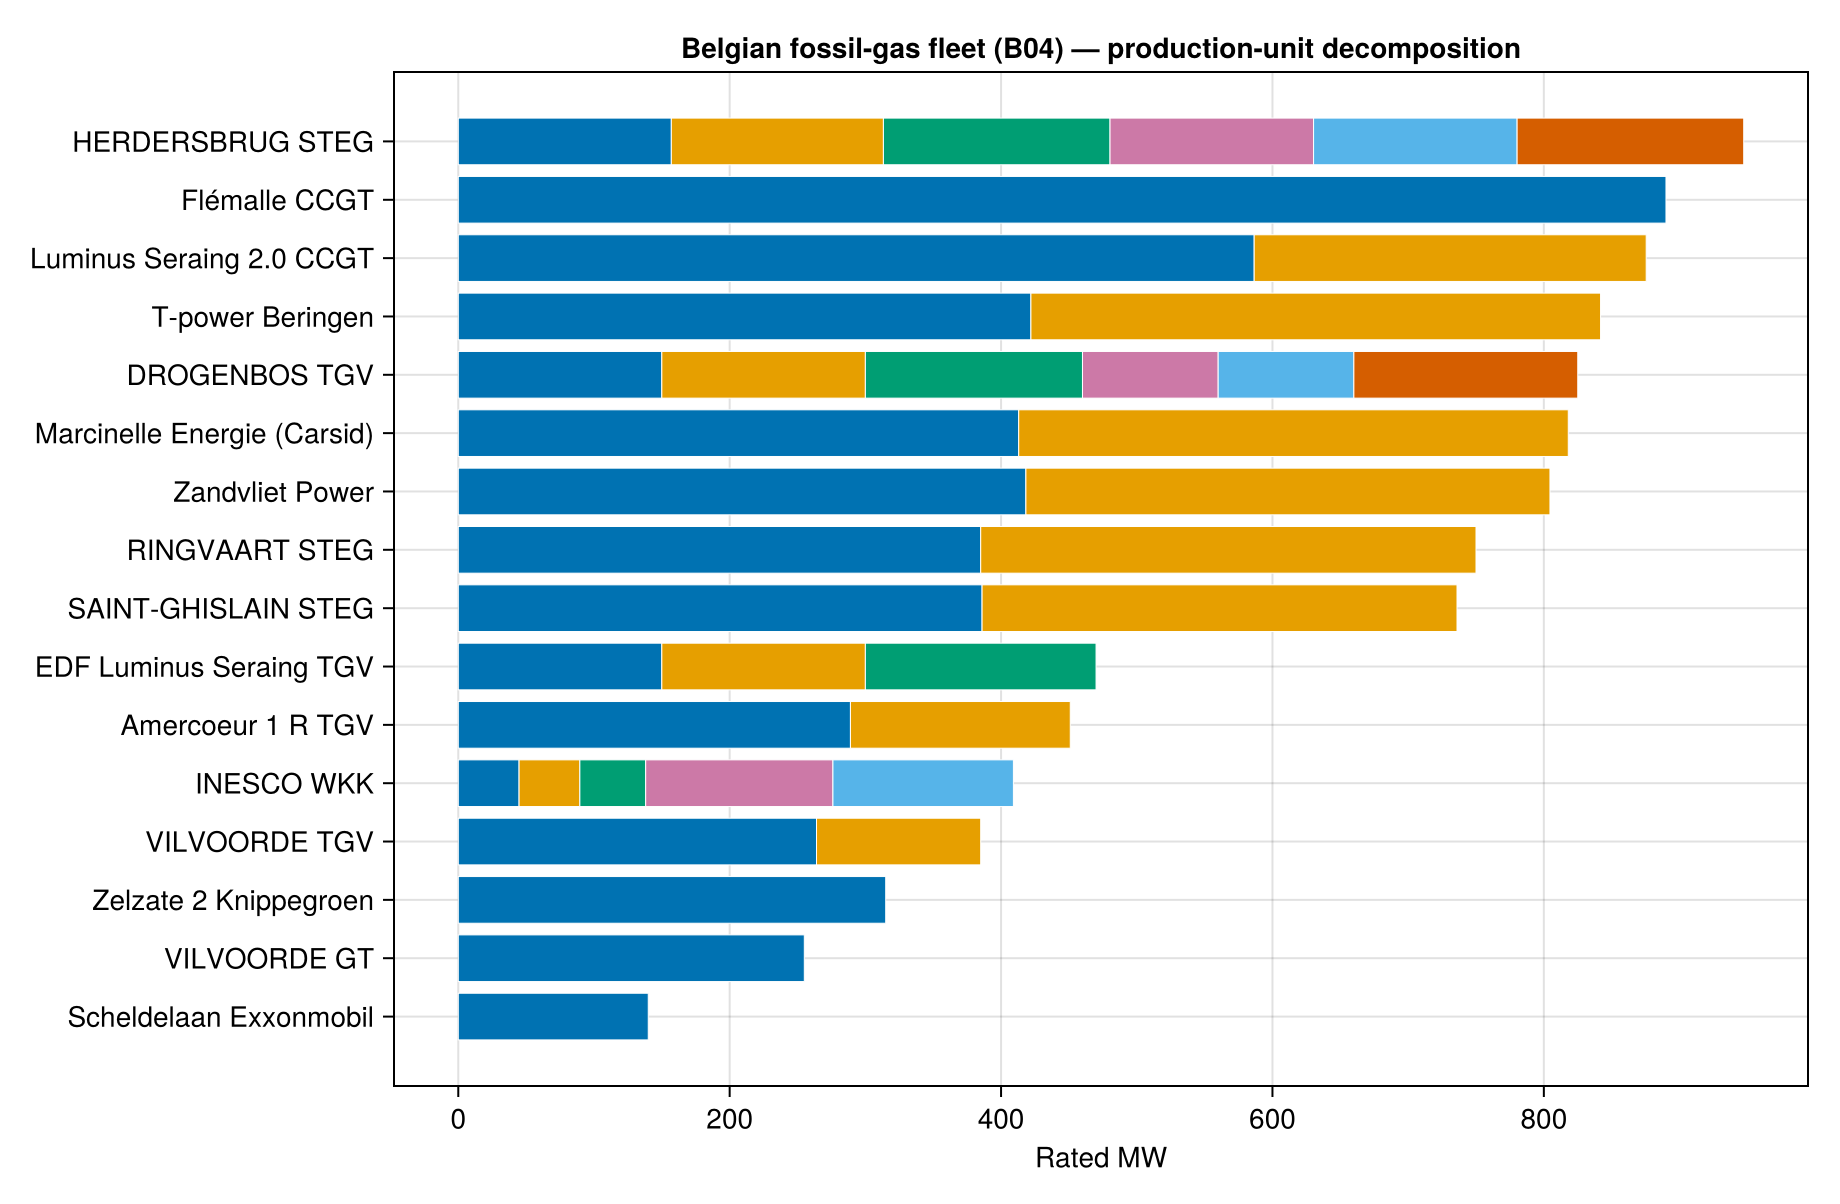
Aggregate stats
finite = filter(!isnan, units.nominal_mw)
(
    total_units             = length(units),
    distinct_production     = length(unique(units.production_unit_mrid)),
    total_rated_mw          = round(Int, sum(finite)),
    median_unit_mw          = round(Int, median(finite)),
    largest_unit_mw         = round(Int, maximum(finite)),
)
(total_units = 40, distinct_production = 15, total_rated_mw = 9913, median_unit_mw = 166, largest_unit_mw = 890)Where to next
Pass
psr_type = nothing(or omit it) to pull all technologies in the bidding zone — useful for full-fleet capacity audits.Combine with
installed_capacity_per_production_type(which publishes the annual aggregate) to cross-check the registry totals against the published year-ahead installed capacity.For outage notices keyed to these
resource_mrids, seeunavailability_of_generation_unitsand the outage timeline tutorial.